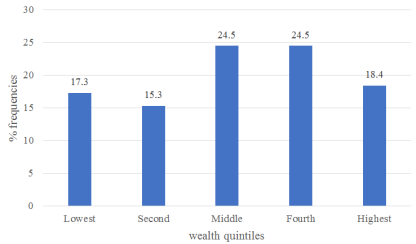
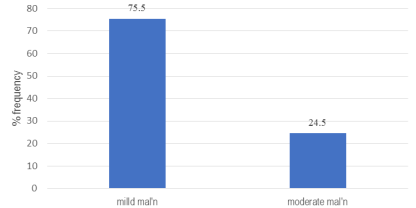
The increasing prevalence of chronic kidney disease (CKD) imposes a huge healthcare burden on developing countries. For patients undergoing hemodialysis (HD), optimal nutritional management is associated with better treatment outcomes and quality of life. However, malnutrition is commonly reported among these patients and calls for investigation of specific aspects of their diet that can be targeted by counseling and other interventions. The study sought to establish the Dietary Practices and Nutrition Status Hemodialysis patients in Meru County. This study investigated a sample size of 98 hemodialysis patients across health facilities in Meru County on their dietary practices and nutritional status. The study adopted a descriptive cross-sectional design. Respondents were randomly selected from three health facilities offering dialysis services within the County. Data was collected using researcher-administered structured questionnaires. Nutritional Status was assessed by both Body Mass Index (BMI) and a modified Subjective Global Assessment (SGA) tool. A single 24-hour recall was used to assess nutrient intake. Weight and height were taken using electronic scales and stadiometers respectively. Data was cleaned in Excel sheets then transferred into the Statistical Package for Social Science (SPSS) version 25 software for analysis employing descriptive statistics. The findings show that majority (56.8%) of the respondents had medium dietary diversity. The mean dietary diversity score (DDS) was 3.79+1.0. The most consumed food group was starchy staples (100% frequency), while the least consumed food group was organ meats consumed (2.1%). The mean intakes of energy and protein were 1121.28±479.42 and 40.73±21.82 respectively. The mean intakes for key micronutrients including calcium, phosphorous, potassium, sodium magnesium, zinc and iron in mg/day were 317.84±207.84, 858.69±344.10, 1463.84±785.86, 1118.47±707.69, 216.07±88.94, 6.32±3.41 and 10.81±5.36. Except for proteins and iron, various nutrients were consumed below the recommendations by majority of respondents. The mean BMI (kg/m2) and SGA score of the respondents were 21.64±3.72 and 18.82±3. 71 respectively. Based on the WHO classification system 67.3%, 17.4% and 15.3% of the respondents were normal weight, underweight and overweight/obese respectively. However, based on the SGA scores 75.5% and 24.5% of the respondents had mild malnutrition and moderate malnutrition respectively. Over a quarter of haemodialysis patients have poor nutrition status. There is need to scale individualized dietary counselling interventions to improve the dietary practices for better nutritional outcomes among the haemodialysis patient population in Meru County.
| Published in | International Journal of Nutrition and Food Sciences (Volume 14, Issue 4) |
| DOI | 10.11648/j.ijnfs.20251404.17 |
| Page(s) | 248-259 |
| Creative Commons |
This is an Open Access article, distributed under the terms of the Creative Commons Attribution 4.0 International License (http://creativecommons.org/licenses/by/4.0/), which permits unrestricted use, distribution and reproduction in any medium or format, provided the original work is properly cited. |
| Copyright |
Copyright © The Author(s), 2025. Published by Science Publishing Group |
Dietary Practices, Nutritional Status, Hemodialysis Patients, Chronic Kidney Disease
Variable N | Category | Frequency (N=98) | Percent (%) |
|---|---|---|---|
Gender | male | 61 | 62.2 |
female | 37 | 37.8 | |
Marital status | single | 18 | 18.4 |
married | 74 | 75.5 | |
widowed | 5 | 5.1 | |
separated | 1 | 1.0 | |
Education | informal | 7 | 7.1 |
primary | 42 | 42.9 | |
secondary | 28 | 28.6 | |
tertiary | 16 | 16.3 | |
university | 5 | 5.1 | |
Employment status | self-employment | 36 | 36.7 |
formal employment | 7 | 7.1 | |
unemployment | 37 | 37.8 | |
retired | 18 | 18.4 | |
Age (mean ± SD) | 53.19 ± 15.0 | ||
HH size (mean ± SD) | 5.28 ± 2.26 | ||
Food Group | Frequency (N=95) | Percent (%) | |
|---|---|---|---|
1 | Starchy staples | 95 | 100 |
2 | Dark Green Leafy Vegetables | 19 | 20.0 |
3 | Other Vitamin A rich Fruits and Vegetables | 13 | 13.7 |
4 | Other Fruits and Vegetables | 56 | 58.9 |
5 | Organ meats | 2 | 2.1 |
6 | Meat and Fish | 35 | 36.8 |
7 | Eggs | 23 | 24.2 |
8 | Legumes, Nuts and Seeds | 56 | 58.9 |
9 | Milk and Milk Products | 61 | 64.2 |
DDS (Mean±SD) | 3.79 ± 1.0 (2 - 7) | ||
DDS category | Frequency | Percent (%) |
|---|---|---|
Low dietary diversity (< 4 FGs) | 38 | 40 |
Medium dietary diversity (4-5 FGs) | 54 | 56.8 |
High dietary diversity (≥ 6 FGs) | 3 | 3.2 |
Total | 95 | 100 |
Nutrient | Units | RDIs | Mean intake (N=94) | Range |
|---|---|---|---|---|
Energyab | Kcal | - | 1121.28±479.42 | 364.34 - 2816.06 |
Proteina | g | ≥ 35 (≥ 30) | 40.73±21.82 | 8.09 - 112.65 |
CHOs | g | 1.0-1.2 | 155.27±60.17 | 34.63 - 317.06 |
Fat | g | 30-40 | 32.89±21.15 | 2.55 - 136.28 |
Fiber | g | 20-30 | 22.73±10.39 | 1.94 - 44.49 |
Calcium | mg | 500-800 | 317.84±207.84 | 55.88 - 1214.37 |
Phosphorous | mg | 800-1000 | 858.69±344.10 | 127.52 - 2003.42 |
Potassium | mg | 2000-2500 | 1463.84±785.86 | 187.76 - 3641.1 |
Sodium | mg | 1500-2300 | 1118.47±707.69 | 24.08 - 3976.45 |
Magnesium | mg | 200-300 | 216.07±88.94 | 49.11 - 452.58 |
Zincc | mg | 10-15 (8-12) | 6.32±3.41 | 0.9 - 18.84 |
Ironc | mg | ≥ 8 (≥ 15) | 10.81±5.36 | 0.97 - 24.79 |
Variable | Meeting recommendations (N=94) | % above recommendations | % below recommendations | ||
|---|---|---|---|---|---|
category | n | % | |||
Macronutrients | |||||
Energy | yes no | 8 86 | 8.5 91.5 | - - | 91.5 |
Protein | yes no | 19 75 | 20.2 79.8 | 84.0 | 16.0 |
Micronutrients | |||||
Calcium | yes no | 11 83 | 11.7 88.3 | 2.4 | 97.6 |
Phosphorous | yes no | 17 77 | 18.1 81.9 | 46.8 | 53.2 |
Potassium | yes no | 7 87 | 7.4 92.6 | 12.6 | 87.4 |
Sodium | yes no | 19 75 | 20.2 79.8 | 12.7 | 87.3 |
Magnesium | yes no | 33 61 | 35.1 64.9 | 27.4 | 72.6 |
Zinc | Yes no | 14 80 | 14.3 85.1 | 2.5 | 97.5 - |
Iron | Yes no | 55 38 | 59.1 40.9 | - | 40.9 - |
Variable | Mean ± SD (N=98) |
|---|---|
BMI | 21.64±3.72 |
SGA score | 18.82±3.71 |
BMI | Body Mass Index |
HD | Haemodialysis |
CKD | Chronic Kidney Disease |
RDIs | Recommended Daily Intakes |
SGA | Subjective Global Assessment |
| [1] | V. Mwenda, J. Githuku, G. Gathecha, B. M. Wambugu, Z. G. Roka, and W. O. Ong’or, “Prevalence and factors associated with chronic kidney disease among medical inpatients at the Kenyatta National Hospital, Kenya, 2018: a cross-sectional study,” Pan Afr. Med. J., vol. 33, 2019, |
| [2] |
County Government of Meru, “Meru County Acquires Dialysis Machines,” County Government of Meru. Accessed: Jul. 18, 2025. [Online]. Available:
https://meru.go.ke/214/meru-county-acquires-dialysis-machines/ |
| [3] | A. Oketch, “Kenya: MES Dialysis Kits Offer Respite as Cases Surge,” The Nation, Nairobi, May 17, 2021. Accessed: Jul. 18, 2025. [Online]. Available: |
| [4] | A. Ruto, “Dialysis now closer to home for kidney failure patients,” The Star. Accessed: Jul. 18, 2025. [Online]. Available: |
| [5] | H.-S. Lim, H.-S. Kim, J. K. Kim, M. Park, and S. J. Choi, “Nutritional Status and Dietary Management According to Hemodialysis Duration,” Clin. Nutr. Res., vol. 8, no. 1, p. 28, 2019, |
| [6] | C. D’Alessandro et al., “‘Dietaly’: practical issues for the nutritional management of CKD patients in Italy,” BMC Nephrol., vol. 17, no. 1, p. 18, Dec. 2016, |
| [7] |
D. Luis et al., “Dietary Quality and Adherence to Dietary Recommendations in Patients Undergoing Hemodialysis.,” J Ren Nutr, vol. 26, no. 3, pp. 190-5, 2016,
https://doi.org/10.1053/j.jrn.2015.11.004 Epub 2016 Jan 27. |
| [8] | F. Esra, “Medical Nutrition Therapy for Hemodialysis Patients,” in Hemodialysis, InTech, 2013, pp. 21-42. |
| [9] | M. M. Fawzy, N. E. Morsy, and D. S. E.-D. A. El-Moneem, “Nutritional assessment among patients with chronic renal failure undergoing hemodialysis,” Egypt. Nurs. J., vol. 18, no. 2, pp. 51-57, May 2021, |
| [10] | R. O. Opiyo et al., “Factors associated with adherence to dietary prescription among adult patients with chronic kidney disease on hemodialysis in national referral hospitals in Kenya: a mixed-methods survey,” Ren. Replace. Ther., vol. 5, no. 1, p. 41, Dec. 2019, |
| [11] | P. Bramania, P. Ruggajo, R. Bramania, M. Mahmoud, and F. Furia, “Nutritional Status of Patients on Maintenance Hemodialysis at Muhimbili National Hospital in Dar es Salaam, Tanzania: A Cross-Sectional Study,” J. Nutr. Metab., vol. 2021, pp. 1-7, May 2021, |
| [12] | R. Moustakim, M. Mziwira, M. El Ayachi, and R. Belahsen, “Dietary diversity score and the incidence of chronic kidney disease in an agricultural Moroccan adults population,” Rocz. Państw. Zakładu Hig., vol. 73, no. 3, pp. 293-301, Sep. 2022, |
| [13] | L. Cornelsen et al., “Cross-sectional study of drivers of animal-source food consumption in low-income urban areas of Nairobi, Kenya,” BMC Nutr., vol. 2, no. 1, p. 70, Dec. 2016, |
| [14] | S. Kim and J. Jung, “Nutritional management in patients with chronic kidney disease,” Korean J. Intern. Med., vol. 35, no. 6, pp. 1279-1290, Nov. 2020, |
| [15] | N. A. Gityamwi, K. H. Hart, and B. Engel, “A Cross-Sectional Analysis of Dietary Intake and Nutritional Status of Patients on Haemodialysis Maintenance Therapy in a Country of Sub-Saharan Africa,” Int. J. Nephrol., vol. 2021, pp. 1-12, May 2021, |
| [16] | R. M. Muthoni, J. N. Waudo, and R. W. Kamuhu, “Diet and Comorbidities Affecting Hemodialysis Patients at the Renal Unit in Kenyatta National Hospital, Kenya: A Cross Sectional Analytic Study,” Int. J. Health Sci. Res., vol. 13, no. 7, pp. 110-121, Jul. 2023, |
| [17] | Z. Xie, R. McLean, and M. Marshall, “Dietary Sodium and Other Nutrient Intakes among Patients Undergoing Hemodialysis in New Zealand,” Nutrients, vol. 10, no. 4, p. 502, Apr. 2018, |
| [18] | N. K. Maurya, P. Arya, and N. S. Sengar, “Dietary Intake And Nutritional Status in Hemodialysis Patients,” Int. Res. J. Pharm., vol. 10, no. 4, pp. 102-105, May 2019, |
| [19] | V. M. Saglimbene et al., “Dietary intake in adults on hemodialysis compared with guideline recommendations,” J. Nephrol., vol. 34, no. 6, pp. 1999-2007, Dec. 2021, |
| [20] | H. Beerappa and R. Chandrababu, “Adherence to dietary and fluid restrictions among patients undergoing hemodialysis: An observational study,” Clin. Epidemiol. Glob. Health, vol. 7, no. 1, pp. 127-130, Mar. 2019, |
| [21] | H. Kim, H. Lim, and R. Choue, “A Better Diet Quality is Attributable to Adequate Energy Intake in Hemodialysis Patients,” Clin. Nutr. Res., vol. 4, no. 1, p. 46, 2015, |
| [22] | C. M. Avesani, D. Teta, and J. J. Carrero, “Liberalizing the diet of patients undergoing dialysis: are we ready?,” Nephrol. Dial. Transplant., vol. 34, no. 2, pp. 180-183, Feb. 2019, |
| [23] | N. Kaesler et al., “Low adherence to CKD-specific dietary recommendations associates with impaired kidney function, dyslipidemia, and inflammation,” Eur. J. Clin. Nutr., vol. 75, no. 9, pp. 1389-1397, Sep. 2021, |
| [24] | S. Joshi, S. Singh, and A. Singh, “Evaluation of Nutritional Status of Chronic Kidney Disease Patients Undergoing Hemodialysis,” Med Phoenix, vol. 5, no. 1, pp. 19-25, Sep. 2020, |
| [25] | S. Nagabhushana, M. Ranganatha, G. K. Ranjith Kumar, and Virupakshappa, “Evaluation of nutritional status in chronic kidney disease patients undergoing hemodialysis,” Int J Adv Med, vol. 4, no. 4, p. 907, 2017. |
| [26] | S. Abozead, A. Ahmed, and M. Mahmoud, “Nutritional Status and Malnutrition Prevalence among Maintenance Hemodialysis Patients,” IOSR J Nurs Health Sci IOSR-JNHS, vol. 4, no. 4, pp. 51-58, Dec. 2017. |
| [27] | J. Lima, S. Bernardes, and F. Silva, “Body mass index is not accurate to diagnose malnutrition in hospitalized patients: a crosssectional analysis,” BRASPEN J., vol. 37, no. 4, 2022, |
| [28] | L. Visiedo et al., “The impact of nutritional status on health-related quality of life in hemodialysis patients,” Sci. Rep., vol. 12, no. 1, Feb. 2022, |
| [29] | B. Kistler, D. Benner, M. Burgess, M. Stasios, K. Kalantar-Zadeh, and K. R. Wilund, “To Eat or Not to Eat—International Experiences With Eating During Hemodialysis Treatment,” J. Ren. Nutr., vol. 24, no. 6, pp. 349-352, Nov. 2014, |
APA Style
Wanjiku, K. P., Regina, K., Elizabeth, K. (2025). Dietary Practices and Nutritional Status of Hemodialysis Patients in Meru County. International Journal of Nutrition and Food Sciences, 14(4), 248-259. https://doi.org/10.11648/j.ijnfs.20251404.17
ACS Style
Wanjiku, K. P.; Regina, K.; Elizabeth, K. Dietary Practices and Nutritional Status of Hemodialysis Patients in Meru County. Int. J. Nutr. Food Sci. 2025, 14(4), 248-259. doi: 10.11648/j.ijnfs.20251404.17
AMA Style
Wanjiku KP, Regina K, Elizabeth K. Dietary Practices and Nutritional Status of Hemodialysis Patients in Meru County. Int J Nutr Food Sci. 2025;14(4):248-259. doi: 10.11648/j.ijnfs.20251404.17
@article{10.11648/j.ijnfs.20251404.17,
  author = {Karoki Phyllis Wanjiku and Kamuhu Regina and Kuria Elizabeth},
  title = {Dietary Practices and Nutritional Status of Hemodialysis Patients in Meru County
},
  journal = {International Journal of Nutrition and Food Sciences},
  volume = {14},
  number = {4},
  pages = {248-259},
  doi = {10.11648/j.ijnfs.20251404.17},
  url = {https://doi.org/10.11648/j.ijnfs.20251404.17},
  eprint = {https://article.sciencepublishinggroup.com/pdf/10.11648.j.ijnfs.20251404.17},
  abstract = {The increasing prevalence of chronic kidney disease (CKD) imposes a huge healthcare burden on developing countries. For patients undergoing hemodialysis (HD), optimal nutritional management is associated with better treatment outcomes and quality of life. However, malnutrition is commonly reported among these patients and calls for investigation of specific aspects of their diet that can be targeted by counseling and other interventions. The study sought to establish the Dietary Practices and Nutrition Status Hemodialysis patients in Meru County. This study investigated a sample size of 98 hemodialysis patients across health facilities in Meru County on their dietary practices and nutritional status. The study adopted a descriptive cross-sectional design. Respondents were randomly selected from three health facilities offering dialysis services within the County. Data was collected using researcher-administered structured questionnaires. Nutritional Status was assessed by both Body Mass Index (BMI) and a modified Subjective Global Assessment (SGA) tool. A single 24-hour recall was used to assess nutrient intake. Weight and height were taken using electronic scales and stadiometers respectively. Data was cleaned in Excel sheets then transferred into the Statistical Package for Social Science (SPSS) version 25 software for analysis employing descriptive statistics. The findings show that majority (56.8%) of the respondents had medium dietary diversity. The mean dietary diversity score (DDS) was 3.79+1.0. The most consumed food group was starchy staples (100% frequency), while the least consumed food group was organ meats consumed (2.1%). The mean intakes of energy and protein were 1121.28±479.42 and 40.73±21.82 respectively. The mean intakes for key micronutrients including calcium, phosphorous, potassium, sodium magnesium, zinc and iron in mg/day were 317.84±207.84, 858.69±344.10, 1463.84±785.86, 1118.47±707.69, 216.07±88.94, 6.32±3.41 and 10.81±5.36. Except for proteins and iron, various nutrients were consumed below the recommendations by majority of respondents. The mean BMI (kg/m2) and SGA score of the respondents were 21.64±3.72 and 18.82±3. 71 respectively. Based on the WHO classification system 67.3%, 17.4% and 15.3% of the respondents were normal weight, underweight and overweight/obese respectively. However, based on the SGA scores 75.5% and 24.5% of the respondents had mild malnutrition and moderate malnutrition respectively. Over a quarter of haemodialysis patients have poor nutrition status. There is need to scale individualized dietary counselling interventions to improve the dietary practices for better nutritional outcomes among the haemodialysis patient population in Meru County.},
 year = {2025}
}
TY  - JOUR
T1  - Dietary Practices and Nutritional Status of Hemodialysis Patients in Meru County

AU  - Karoki Phyllis Wanjiku
AU  - Kamuhu Regina
AU  - Kuria Elizabeth
Y1  - 2025/08/13
PY  - 2025
N1  - https://doi.org/10.11648/j.ijnfs.20251404.17
DO  - 10.11648/j.ijnfs.20251404.17
T2  - International Journal of Nutrition and Food Sciences
JF  - International Journal of Nutrition and Food Sciences
JO  - International Journal of Nutrition and Food Sciences
SP  - 248
EP  - 259
PB  - Science Publishing Group
SN  - 2327-2716
UR  - https://doi.org/10.11648/j.ijnfs.20251404.17
AB  - The increasing prevalence of chronic kidney disease (CKD) imposes a huge healthcare burden on developing countries. For patients undergoing hemodialysis (HD), optimal nutritional management is associated with better treatment outcomes and quality of life. However, malnutrition is commonly reported among these patients and calls for investigation of specific aspects of their diet that can be targeted by counseling and other interventions. The study sought to establish the Dietary Practices and Nutrition Status Hemodialysis patients in Meru County. This study investigated a sample size of 98 hemodialysis patients across health facilities in Meru County on their dietary practices and nutritional status. The study adopted a descriptive cross-sectional design. Respondents were randomly selected from three health facilities offering dialysis services within the County. Data was collected using researcher-administered structured questionnaires. Nutritional Status was assessed by both Body Mass Index (BMI) and a modified Subjective Global Assessment (SGA) tool. A single 24-hour recall was used to assess nutrient intake. Weight and height were taken using electronic scales and stadiometers respectively. Data was cleaned in Excel sheets then transferred into the Statistical Package for Social Science (SPSS) version 25 software for analysis employing descriptive statistics. The findings show that majority (56.8%) of the respondents had medium dietary diversity. The mean dietary diversity score (DDS) was 3.79+1.0. The most consumed food group was starchy staples (100% frequency), while the least consumed food group was organ meats consumed (2.1%). The mean intakes of energy and protein were 1121.28±479.42 and 40.73±21.82 respectively. The mean intakes for key micronutrients including calcium, phosphorous, potassium, sodium magnesium, zinc and iron in mg/day were 317.84±207.84, 858.69±344.10, 1463.84±785.86, 1118.47±707.69, 216.07±88.94, 6.32±3.41 and 10.81±5.36. Except for proteins and iron, various nutrients were consumed below the recommendations by majority of respondents. The mean BMI (kg/m2) and SGA score of the respondents were 21.64±3.72 and 18.82±3. 71 respectively. Based on the WHO classification system 67.3%, 17.4% and 15.3% of the respondents were normal weight, underweight and overweight/obese respectively. However, based on the SGA scores 75.5% and 24.5% of the respondents had mild malnutrition and moderate malnutrition respectively. Over a quarter of haemodialysis patients have poor nutrition status. There is need to scale individualized dietary counselling interventions to improve the dietary practices for better nutritional outcomes among the haemodialysis patient population in Meru County.
VL  - 14
IS  - 4
ER  -
Department of Health Science, Thika Technical Training Institute, Thika, Kenya. School of Health Science, Kenyatta University, Nairobi, Kenya
Biography: Karoki Phyllis Wanjiku is a Nutritionist and Dietician Trainer at Thika Technical Training Institute. She is a master’s student at Ken-yatta University and a holder in Bachelor’s degree from Kenyatta University (2014).
Research Fields: Non-communicable disease and nutrition

School of Health Science, Kenyatta University, Nairobi, Kenya
Biography: Kamuhu Regina is a lecturer at Kenyatta University Department of Food Nutrition and Dietetics. She holds a PHD in Foods, Nutrition and Dietetics from Kenyatta University (2016) and a master’s degree from University of Panjab, India.
Research Fields: HIV dyslipidaemia, Utilization of ground nuts/peanut in treatment of lipid disorders in HIV and diabetes

School of Health Science, Kenyatta University, Nairobi, Kenya
Biography: Kuria Elizabeth is an Associate Professor, Department of Food Nutrition and Dietetics, Kenyatta University. She holds a PHD from Edith Cowan University, Australia and a Master’s degree from Kenyatta University.
Research Fields: Food and nutrition security, Gender, Education and Socio protection