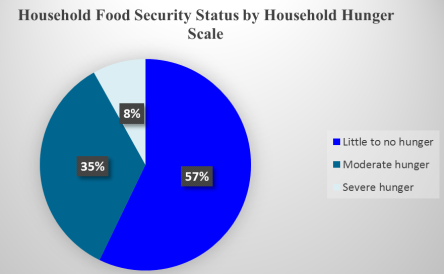
Globally, undernutrition is among the top causes of morbidity and mortality among children 6-23 months old. In Lungalunga, Kwale County, Kenya, similarly to many parts of the county, only 30.4% of children aged 6–23 months receive appropriate complementary feeding (Minimum Acceptable Diet (MAD)); a composite indicator of Minimum Dietary Diversity (MDD) and Minimum Meal Frequency (MMF). Kwale County is a semi-arid land (ASAL) and experiences chronic food insecurity. This study therefore, sought to establish the state of household food security and how it is related to complementary feeding practices among children 6–23 months old in Lungalunga, Kwale County. The study used a cross-sectional analytical research design and to select the study participants, multistage random sampling was used. In-person interviews were conducted at the household to collect information on complementary feeding practices and household food security. For analysis, the study used Statistical Package for Social Sciences (SPSS) version 27. Chi-square test, Fisher’s exact, linear by linear and logistic regression were used to establish the association between the variables. A statistical significance level (p-value) of <0.05, corresponding to a 95% confidence level was used. About one-tenth (8.1%) of the households experienced severe hunger, 34.7% moderate hunger and 57.1% experienced little to no hunger. All (100%) of the children had received soft, semi-solid or solid meals based on a twenty-four recall. Around three-quarters (76.8%) of the children achieved MMF, 24.1% attained MDD, and only 21.6% had MAD. Significant relationships were observed between all the three indicators of complementary feeding practices (MMF, MDD and MAD) and household food security at a p <0.01. Children from households that experienced moderate hunger had 30% higher odds (OR = 1.298, 95% CI = [1.118, 1.753], p =0.011) of attaining MMF than those experiencing severe hunger, those experiencing 'little to no hunger' were 87% more likely (OR = 1.87, 95% CI = [1.173, 2.473], p < 0.01) to achieve MDD than those experiencing severe hunger and those that experienced 'little to no hunger' had 19% higher odds (OR = 1.191, 95% CI = [1.075, 1.488], p = 0.001) of meeting the MAD than those in severe hunger category. Breastfeeding among children, wealth index, caregivers’ occupation and level of education and household food security were significant predictors of complementary feeding. Therefore, addressing household food security in Lungalunga will significantly improve the complementary feeding practices of children 6-23 months old.
| Published in | International Journal of Nutrition and Food Sciences (Volume 14, Issue 6) |
| DOI | 10.11648/j.ijnfs.20251406.19 |
| Page(s) | 456-474 |
| Creative Commons |
This is an Open Access article, distributed under the terms of the Creative Commons Attribution 4.0 International License (http://creativecommons.org/licenses/by/4.0/), which permits unrestricted use, distribution and reproduction in any medium or format, provided the original work is properly cited. |
| Copyright |
Copyright © The Author(s), 2025. Published by Science Publishing Group |
Household Food Security, Under-nutrition, Complementary Feeding, Minimum Meal Frequency, Minimum Dietary Diversity, Minimum Acceptable Diet
Variables (N = 357) | n | % | M (IQR) |
|---|---|---|---|
Caregivers age | |||
< 20 years | 55 | 15.4 | |
20 - 29 years | 201 | 56.4 | |
30 - 39 years | 63 | 17.6 | |
≥ 40 years | 38 | 10.6 | |
Mean (SD) age of caregivers | 27 ± 8 | ||
Median age of Caregivers | 24 (10) | ||
Caregiver's education level | |||
Primary | 236 | 66.1 | |
Secondary | 40 | 11.2 | |
Tertiary | 43 | 12 | |
No formal education | 38 | 10.6 | |
Caregivers’ marital status | |||
Married | 286 | 80.1 | |
Divorced | 43 | 12.1 | |
Never Married | 28 | 7.8 | |
Mean (SD) age of children (In months) | 14 ± 5 | ||
Median Age of Children (In Months) | 13 (10) | ||
Children's Age group | |||
6 - 8 Months | 78 | 21.8 | |
9 - 23 Months | 279 | 78.2 | |
Children's gender | |||
Female | 196 | 54.9 | |
Male | 161 | 45.1 | |
Households owning agricultural land | 315 | 88.2 | |
Father's Occupation | |||
Informal Employment | 234 | 83.5 | |
Formal Employment | 43 | 15.4 | |
Unemployed | 3 | 1.1 | |
Mother's Occupation | |||
Unemployed | 223 | 65.8 | |
Informal Employment | 80 | 23.6 | |
Formal Employment | 36 | 10.6 | |
Household Wealth Index | |||
Lowest | 131 | 36.7 | |
Second lowest | 43 | 12 | |
Middle | 63 | 17.6 | |
Fourth | 91 | 25.5 | |
M (IQR) = Median and Interquartile Range; n = frequency | |||
Variables | n | % |
|---|---|---|
Breastfeeding (At the time of data collection) (N = 357) | ||
Yes | 269 | 75.4 |
No | 88 | 24.6 |
Minimum Meal Frequency (MMF) | ||
Breastfed children aged 6-8 Months consuming 2* times (N=78) | 56 | 71.8 |
Breastfed children aged 9-23 Months consuming 3* times (N = 279) | 162 | 58.1 |
Non-breastfed children aged 6-23 Months consuming 4* times (N = 88) | 56 | 63.6 |
Overall Minimum Meal Frequency (MMF) (N=357) | 274 | 76.8 |
Overall Minimum Dietary Diversity (MDD) (N=357) | 86 | 24.1 |
Minimum Acceptable Diet (MAD) | ||
Breastfed children aged 6-23 Months (N =269) | 76 | 28.3 |
Non-breastfed aged children 6 - 23 Months with at least 2 milk feeds (N=88) | 1 | 1.1 |
Overall MAD (N=357) | 77 | 21.6 |
* Consuming food and / or milk feeds for non-breastfed | ||
Socio-demographic factors (N=357) | Complementary feeding practice | Fisher's Exact value | P-value | |
|---|---|---|---|---|
n (%) | n (%) | |||
Minimum Meal Frequency (MMF) | ||||
Did not attain MMF | Attained MMF | |||
Education Level | ||||
Primary school | 57 (24.2) | 179 (75.8) | 23.97 | <0.01 |
Secondary school | 12 (30.0) | 28 (70.0) | ||
Tertiary | 0 | 43 (100) | ||
No formal education | 14 (36.8) | 24 (63.2) | ||
Marital status | ||||
Married | 71 (24.8) | 76 (26.6) | 2.863 | 0.233 |
Divorced | 9 (20.9) | 2 (4.7) | ||
Not married | 3 (10.7) | 8 (28.6) | ||
Minimum Dietary Diversity (MDD) | ||||
Did not attain MDD | Attained MDD | |||
Education Level | ||||
Primary school | 201 (85.2) | 35 (14.8) | 122.246 | <0.01 |
Secondary school | 29 (72.5) | 11 (27.5) | ||
Tertiary | 3 (7.0) | 40 (93.0) | ||
No formal education | 38 (100) | 0 | ||
Marital status | ||||
Married | 210 (73.4) | 215 (75.2) | 12.22 | 0.002 |
Divorced | 41 (95.3) | 34 (79.1) | ||
Not married | 20 (71.4) | 25 (89.3) | ||
Minimum Acceptable Diet (MAD) | ||||
Did not attain MAD | Attained MAD | |||
Education Level | ||||
Primary school | 203 (86.0) | 33 (14.0) | 83.798 | <0.01 |
Secondary school | 29 (72.5) | 11 (27.5) | ||
Tertiary | 10 (23.3) | 33 (76.7) | ||
No formal education | 38 (100) | 0 | ||
Marital status | ||||
Married | 219 (76.6) | 67 (23.4) | 10.223 | 0.006 |
Divorced | 41 (95.3) | 2 (4.7) | ||
Not married | 20 (71.4) | 8 (28.6) | ||
Wealth Index (N=357) | Complementary feeding practice | Fisher's Exact value | P-value | |
|---|---|---|---|---|
n (%) | n (%) | |||
Minimum Meal Frequency (MMF) | ||||
Did not attain MMF | Attained MMF | |||
Lowest | 45 (34.4) | 86 (65.6) | 27.593 | <0.01 |
Second | 14 (32.6) | 29 (67.4) | ||
Middle | 9 (14.3) | 54 (85.7) | ||
Fourth | 15 (16.5) | 76 (83.5) | ||
Highest | 0 | 29 (100) | ||
Minimum Dietary Diversity (MDD) | ||||
Did not attain MDD | Attained MDD | |||
Lowest | 131 (100) | 0 | 131.01 | <0.01 |
Second | 40 (93.0) | 3 (0.7) | ||
Middle | 47 (74.6) | 16 (25.4) | ||
Fourth | 40 (44.0) | 51 (56) | ||
Highest | 13 (44.8) | 16 (55.2) | ||
Minimum Acceptable Diet (MAD) | ||||
Did not attain MAD | Attained MAD | |||
Lowest | 131 (100) | 0 | 121.023 | <0.01 |
Second | 40 (93.0) | 3 (7.0) | ||
Middle | 52 (82.5) | 11 (17.5) | ||
Fourth | 44 (48.4) | 47 (51.6) | ||
Highest | 13 (44.8) | 16 (55.2) | ||
Caregivers employment status | Complementary feeding practice | Chi-sq. / Fisher's Exact value | P-value | |
|---|---|---|---|---|
n (%) | n (%) | |||
Minimum Dietary Diversity (MDD) | ||||
Did not attain MDD | Attained MDD | |||
Unemployed | 199 (89.2) | 24 (10.8) | 102.851 | <0.01 |
Informal Employment | 49 (61.2) | 31 (38.8) | ||
Formal Employment | 5 (13.9) | 31 (86.1) | ||
Minimum Meal Frequency (MMF) | ||||
Did not attain MMF | Attained MMF | |||
Unemployed | 65 (29.1) | 158 (70.9) | 15.972 | <0.01 |
Informal Employment | 15 (18.8) | 65 (81.2) | ||
Formal Employment | 0 | 36 (100) | ||
Minimum Acceptable Diet (MAD) | ||||
Did not attain MAD | Attained MAD | |||
Unemployed | 199 (89.2) | 24 (10.8) | 73.961 | <0.01 |
Informal Employment | 53 (66.3) | 27 (33.8) | ||
Formal Employment | 10 (27.8) | 26 (72.2) | ||
Household Hunger Scale (N=357) | Complementary feeding practice | Chi-Sq./ Fisher's Exact value | P-value | |
|---|---|---|---|---|
n (%) | n (%) | |||
Minimum Meal Frequency (MMF) | ||||
Did not attain MMF | Attained MMF | |||
Little to no hunger | 38 (18.6) | 166 (81.4) | 13.864 | <0.01 |
Moderate hunger | 30 (24.2) | 94 (75.8) | ||
Severe hunger | 15 (51.7) | (48.3) | ||
Minimum Dietary Diversity (MDD) | ||||
Did not attain MDD | Attained MDD | |||
Little to no hunger | 128 (62.7) | 76 (37.3) | 51.135 | <0.01 |
Moderate hunger | 114 (91.9) | 10 (8.1) | ||
Severe hunger | 20 (100) | 0 | ||
Minimum Acceptable Diet (MAD) | ||||
Did not attain MAD | Attained MAD | |||
Little to no hunger | 137 (67.2) | 67 (32.8) | 40.49 | <0.01 |
Moderate hunger | 114 (91.9) | 10 (8.1) | ||
Severe hunger | 29 (100) | 0 | ||
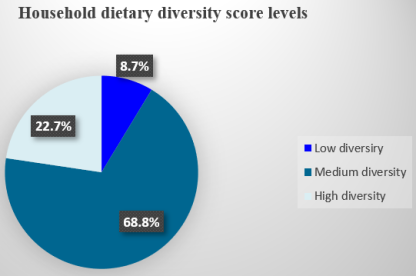
Household Dietary Diversity | Complementary feeding practices | Fisher's Exact value | P-value | |
|---|---|---|---|---|
n (%) | n (%) | |||
Minimum Meal Frequency (MMF) | ||||
Did not attain MMF | Attained MMF | |||
Low diversity | 31 (100) | 0 | 8.581 | 0.013 |
Medium diversity | 205 (83.7) | 40 (16.3) | ||
High diversity | 65 (80.2) | 16 (19.8) | ||
Minimum Dietary Diversity (MDD) | ||||
Did not attain MDD | Attained MDD | |||
Low diversity | 31 (100) | 0 | 131.548 | <0.01 |
Medium diversity | 219 (89.4) | 26 (10.6) | ||
High diversity | 21 (25.9) | 60 (74.1) | ||
Minimum Acceptable Diet (MAD) | ||||
Did not attain MAD | Attained MAD | |||
Low diversity | 31 (100) | 0 | 95.969 | <0.01 |
Medium diversity | 219 (89.4) | 26 (10.6) | ||
High diversity | 30 (37.0) | 51 (63.0) | ||
Variables | AOR | 95% CI | P-value | |
|---|---|---|---|---|
Lower | Upper | |||
Minimum Meal Frequency | ||||
Wealth Index | ||||
Lowest | 1.541 | 0.685 | 3.470 | 0.296 |
Second | 0.231 | 0.208 | 0.352 | 0.012 |
Middle | 0.759 | 0.298 | 0.913 | 0.031 |
Fourth | 0.890 | 0.659 | 1.014 | 0.115 |
Highest | REF | |||
Breastfeeding status of the child | ||||
Yes | 2.443 | 1.437 | 4.152 | 0.001 |
No | REF | |||
Food Security | ||||
Little to no hunger | 0.627 | 0.331 | 1.188 | 0.152 |
Moderate hunger | 1.298 | 1.118 | 1.753 | 0.011 |
Severe hunger | REF | |||
Caregivers' occupation | ||||
Informal Employment | 3.039 | 0.862 | 2.711 | 0.084 |
Formal Employment | 4.211 | 0.775 | 4.671 | 0.353 |
Unemployed | REF | |||
REF = Reference point; * means significant 5% level | ||||
Variables | AOR | 95% CI | P-value | |
|---|---|---|---|---|
Lower | Upper | |||
Minimum Dietary Diversity | ||||
Wealth Index | ||||
Lowest | 0.021 | 0.015 | 1.034 | 0.995 |
Second | 0.122 | 0.025 | 0.594 | 0.009 |
Middle | 0.262 | 0.077 | 0.894 | 0.032 |
Fourth | 0.608 | 0.194 | 1.906 | 0.393 |
Highest | REF | |||
Breastfeeding status of the child | ||||
Yes | 3.072 | 1.510 | 6.246 | 0.002 |
No | REF | |||
Food Security | ||||
Little to no hunger | 1.87 | 1.173 | 2.473 | <0.01 |
Moderate hunger | 0.015 | 0.011 | 1.016 | 0.998 |
Severe hunger | REF | |||
Caregivers' occupation | ||||
Informal Employment | 0.890 | 0.304 | 2.606 | 0.831 |
Formal Employment | 1.070 | 0.348 | 3.296 | 0.906 |
Unemployed | REF | |||
REF = Reference point; * means significant 5% level | ||||
Variables | AOR | 95% CI | P-value | |
|---|---|---|---|---|
Lower | Upper | |||
Minimum Acceptable Diet | ||||
Wealth Index | ||||
Lowest | 0.011 | 0.010 | 1.012 | 0.995 |
Second | 0.121 | 0.025 | 0.575 | 0.008 |
Middle | 0.260 | 0.178 | 0.869 | 0.029 |
Fourth | 0.490 | 0.159 | 1.514 | 0.215 |
Highest | REF | |||
Breastfeeding status of the child | ||||
Yes | 3.459 | 3.211 | 4.421 | <0.01 |
No | REF | |||
Food Security | ||||
Little to no hunger | 1.191 | 1.075 | 1.488 | 0.001 |
Moderate hunger | 0.556 | 0.411 | 1.045 | 0.998 |
Severe hunger | REF | |||
Caregivers' occupation | ||||
Informal Employment | 1.124 | 0.386 | 3.275 | 0.830 |
Formal Employment | 1.196 | 0.392 | 3.647 | 0.753 |
Unemployed | REF | |||
REF = Reference point; * means significant 5% level | ||||
CHU | Community Health Unit |
DD | Dietary Diversity |
FAO | Food and Agriculture Organization |
HDDS | Household Dietary Diversity Scale |
HHS | Household Hunger Scale |
IYCF | Infant Young Child Feeding |
KABP | Knowledge, Attitudes, Beliefs and Practices |
KDHS | Kenya Demographic Health Survey |
MAD | Minimum Acceptable Diet |
MDD | Minimum Dietary Diversity |
MIYCF | Maternal Infant and Young Child Feeding |
MMF | Minimum Meal Frequency |
MOH | Ministry of Health |
WHO | World Health Organization |
| [1] | Hamad HJ, Khashroum A. Household food insecurity (HFIS): Definitions, measurements, socio-demographic and economic aspects. J Nat Sci Res. 2016; 6(2): 63-75-75. |
| [2] | Napoli M, Muro PPD, Mazziotta PM. Towards a Food Insecurity Multidimensional Index (FIMI). 2011; 1-72. |
| [3] | Shaw DJ, Shaw DJ. World Food Summit, 1996. World Food Secur. 2007; 347-60. |
| [4] | FAO. The State of Food Security and Nutrition in the World 2024. FAO; IFAD; UNICEF; WFP; WHO; 2024 [cited 2024 Dec 28]. Available from: |
| [5] | Korir L, Rizov M, Ruto E. Food security in Kenya: Insights from a household food demand model. Econ Model. 2020; 92: 99-108. Available from: |
| [6] | Kipkorir P, Wakhungu H, Jecinta Ali, Mulango E, Nyakundi GN, Kiplagat I, et al. Food and Nutrition Security in Kenya: Embedding Nutrition Element within the Four Pillars of Food Security in the Counties Agriculture Sector. 2024 [cited 2024 Dec 28]; Available from: |
| [7] | National Bureau of Statistics Nairobi K. Kenya Demographic and Health Survey 2022 Key Indicators Report. 2023. Available from: |
| [8] | National Bureau of Statistics-Kenya and ICF International. Kenya 2014 Demographic and Health Survey Key Findings. 2015; 6: 24. |
| [9] | Parada CMGDL, Carvalhaes MADBL, Jamas MT. Complementary feeding practices to children during their first year of life. Rev Lat Am Enfermagem. 2007 Apr [cited 2024 Nov 20]; 15(2): 282-9. Available from: |
| [10] | Almasri Y, Balarajan Y, Blankenship J, Chimanya K, Clark D, Gnilo ME, et al. Improving Young Children ’ s Diets During the Complementary Feeding Period. |
| [11] | Audrey J, Ardythe L. Developmental Readiness of Normal Full Term Infants to Progress from Exclusive Breastfeeding to the Introduction of Complementary Foods Reviews of the Relevant Literature Concerning. 2001. |
| [12] | Shrimpton R, Victora CG, Onis MD, Lima C, Blo M. Worldwide Timing of Growth Faltering: Implications for. 2001; 107(5): 1-7. |
| [13] | Scaling Up Nutrition. Nourishing People and Planet Together: Scaling Up Nutrition (SUN) Movement Progress Report 2019. 2019. |
| [14] | SUN Movement. The Scaling Up Nutrition (SUN) Movement Annual Progress Report. Annu Prog Rep 2018. 2018; |
| [15] | WHO and UNICEF. Indicators for assessing infants and young child feeding practices. 2021. |
| [16] | White JM, Bégin F, Kumapley R, Murray C, Krasevec J. Complementary feeding practices: Current global and regional estimates. Matern Child Nutr. 2017; 13(December 2016): 1-12. |
| [17] | Ochola S. Maternal infant and young child nutrition (MIYCN) knowledge, attitudes, beliefs and practices (KABP) survey report Kwale County. 2017. |
| [18] | Cordero-Ahiman OV, Santellano-Estrada E, Garrido A. Food access and coping strategies adopted by households to fight hunger among indigenous communities of Sierra Tarahumara in Mexico. Sustain Switz. 2018; 10(2): 1-14. |
| [19] | FEWS NET. Kenya Food Security Outlook Update December 2020: Mixed short rains likely to negatively impact crop production and range resources regeneration. 2020. |
| [20] | Saha KK, Frongillo EA, Alam DS, Arifeen SE, Persson LÅ, Rasmussen KM. Household food security is associated with infant feeding practices in rural Bangladesh. J Nutr. 2008; 138(7): 1383-90. |
| [21] | Agbadi P, Urke HB, Mittelmark MB. Household food security and adequacy of child diet in the food insecure region north in Ghana. PLoS ONE. 2017; 12(5): 1-16. |
| [22] | MacHaria TN, Ochola S, Mutua MK, Kimani-Murage EW. Association between household food security and infant feeding practices in urban informal settlements in Nairobi, Kenya. J Dev Orig Health Dis. 2018 Feb 1; 9(1): 20-9. |
| [23] | Government of Kenya. The 2017 Long Rains Season Aassessment Report: Kenya Food Security Steering Group (KFSSG). Report. 2017; (July): 1-11. |
| [24] | KFSSG (Kenya Food Security Steering Group). The 2019 long Rains Mid-Season Food and Nutrition Security Review Report. 2019; (May): 1-21. |
| [25] | KFSSG. Government of Kenya. 2019; (September): 1-67. |
| [26] | Amunga DA, Daniels L, Ochola S. Determinants of Complementary Feeding Practices and Nutritional Status of Children 6 - 23 Months in Pastoralist Communities of Isiolo, Kenya. Curr Res Nutr Food Sci J [Internet]. 2022 Apr 29 [cited 2025 Oct 13]; 10(1): 267-75. Available from: |
| [27] | Korir JR. Determinants of complementary feeding practices and nutritional status of children 6-23 months old in Korogocho slum, Nairobi County, Kenya. 2013; (July): 1-129. |
| [28] | Ndemwa M, Wanyua S, Kaneko S, Karama M, Anselimo M. Nutritional status and association of demographic characteristics with malnutrition among children less than 24 months in Kwale County, Kenya. 2017; Available from: |
| [29] | Spector PE. Do Not Cross Me: Optimizing the Use of Cross-Sectional Designs. J Bus Psychol. 2019; 34(2): 125-37. |
| [30] | County Government of Kwale F. County Government of Kwale. 2013. |
| [31] |
Fisher LD. Self-designing clinical trials. 1998; 1562(October 1997): 1551-62.
https://doi.org/10.1002/(sici)1097-0258(19980730)17:14%3C1551::aid-sim868%3E3.0.co; 2-e |
| [32] | Pourhoseingholi MA, Vahedi M, Rahimzadeh M. Sample size calculation in medical studies. Gastroenterol Hepatol Bed Bench. 2013; 6(1): 14-7. |
| [33] | Gliem JA, Gliem RR. Calculating, Interpreting, and Reporting Cronbach’ s Alpha Reliability Coefficient for Likert-Type Scales. 2003; (1992): 82-8. |
| [34] | Arifin WN. Calculating the Cronbach ’ s alpha coefficients for measurement scales with “ not applicable ” option. 2018; (October). |
| [35] | Guetterman TC. Basics of statistics for primary care research. 2019; 11-7. |
| [36] | Leo GD, Sardanelli F. Statistical significance: p value, 0. 05 threshold, and applications to radiomics — reasons for a conservative approach. 2020; |
| [37] | Canter LW, Canter LW. Data Analysis and Presentation. River Water Qual Monit. 2018; 83-96. |
| [38] | Ali M, Raihan MJ, Siddiqua TJ, Haque MA, Farzana FD, Ahmed SMT, et al. Factors associated with low and medium household dietary diversity compared with high dietary diversity among marginalised households in rural Bangladesh: Findings from a Suchana baseline survey. BMJ Open. 2022 Nov [cited 2024 Dec 29]; 12(11): e062143. Available from: |
| [39] | Mutuku JN. Complementary feeding and nutritional status among children 6-23 months old in Marsabit County, Kenya. 2021; |
| [40] | Mbithe David-Kigaru D, Milelu MM, Mbithe Kigaru DD, Kuria EN. Demographic and socio-economic determinants of availability and access dimensions of household food security in Kitui County, Kenya [Internet]. Vol. 2. 2017 p. 93-101. Available from: |
| [41] | Chepkirui F, Osero J, Nyandieka L. Maternal Factors Associated with Dietary Diversity Scores of Children aged 6-23 Months in Kwale County, Kenya. East Afr Health Res J. 2023 Nov 30 [cited 2025 Mar 31]; 7(2). Available from: |
| [42] | Mwangi F, Omondi E, Technical officer AYSRH, Technical officer community health services, Technical Advisor RMNCAH, Program Manager RMNCAH AMREF Health Africa, et al. Enhancing Food Security and Nutrition through Maternal, Infant, And Young Child Nutrition Support Groups: A Case of Kwale County. In: sustainable food systems, diet, health inequalities and policy [internet]. kenya nutritionists and dieticians institute; 2023 [cited 2025 Mar 31]. Available from: |
| [43] | Ahmed JA, Sadeta KK, Lembo KH. Complementary Feeding Practices and Household Food Insecurity Status of Children Aged 6-23 Months in Shashemene City West Arsi Zone, Oromia, Ethiopia. Nurs Res Pract. 2022; 2022. |
| [44] | WHO, UNICEF, USAID. Consultation report on updating IYCF indicators. 2019. |
| [45] | Khamis AG, Mwanri AW, Ntwenya JE, Kreppel K. The influence of dietary diversity on the nutritional status of children between 6 and 23 months of age in Tanzania. BMC Pediatr. 2019 Dec 28; 19(1). |
| [46] | Molla W, Adem DA, Tilahun R, Shumye S, Kabthymer RH, Kebede D, et al. Dietary diversity and associated factors among children (6-23 months) in Gedeo zone, Ethiopia: cross - sectional study. Ital J Pediatr. 2021 Dec 1; 47(1). |
| [47] | Aboagye RG, Seidu AA, Ahinkorah BO, Arthur-Holmes F, Cadri A, Dadzie LK, et al. Dietary diversity and undernutrition in children aged 6-23 months in sub-saharan africa. Nutrients. 2021 Oct 1; 13(10). |
| [48] | Bowley NA, Pentz-Kluyts MA, Bourne LT, Marino LV, Bowley N. † Private Nutrition Communications Consultancy, Cape Town, ‡ Senior Specialist Scientist, Environment and Health Research Unit, Medical Research Council, Cape Town, and § Manager of Dietetic Services, Red Cross Children’s Hospital Cape Town, Cape Town. Vol. 3, South Africa Maternal and Child Nutrition. 2007 p. 281-91. |
| [49] | Wagris M, Seid A, Kahssay M, Ahmed O. Minimum Meal Frequency Practice and Its Associated Factors among Children Aged 6-23 Months in Amibara District, North East Ethiopia. J Environ Public Health. 2019; 2019. |
| [50] | Birie B, Kassa A, Kebede E, Terefe B. Minimum acceptable diet practice and its associated factors among children aged 6-23 months in rural communities of Goncha district, north West Ethiopia. BMC Nutr. 2021 Dec 1; 7(1). |
| [51] | Swindale A, Bilinksy P. Household Dietary Diversity Score (HDDS) for Measurement of Household Food Access: Indicator Guide (Version 2). 2006; |
| [52] | Mutea E, Hossain MS, Ahmed A, Ifejika Speranza C. Shocks, socio-economic status, and food security across Kenya: policy implications for achieving the Zero Hunger goal. Environ Res Lett. 2022 Sept 1; 17(9). |
| [53] | Bwalya R, Chama-Chiliba CM, Malinga S, Chirwa T. Association between household food security and infant feeding practices among women with children aged 6-23 months in rural Zambia. Chouhan P, editor. PLOS ONE. 2023 Oct 2 [cited 2025 Aug 8]; 18(10): e0292052. Available from: |
| [54] | Kimiywe J, Chege P. Complementary feeding practices and nutritional status of children 6-23 months in Kitui County, Kenya. J Appl Biosci. 2015 Feb 26; 85(1): 7881. |
| [55] | Nurokhmah S, Middleton L, Hendarto A. Prevalence and Predictors of Complementary Feeding Practices Among Children Aged 6-23 Months in Indonesia. J Prev Med Pub Health. 2022 Nov 30 [cited 2025 Oct 17]; 55(6): 549-58. Available from: |
APA Style
Shume, N., Ochola, S., Njogu, E. (2025). Household Food Security and Complementary Feeding Practices Among Children 6-23 Months Old in Lungalunga, Kwale County, Kenya. International Journal of Nutrition and Food Sciences, 14(6), 456-474. https://doi.org/10.11648/j.ijnfs.20251406.19
ACS Style
Shume, N.; Ochola, S.; Njogu, E. Household Food Security and Complementary Feeding Practices Among Children 6-23 Months Old in Lungalunga, Kwale County, Kenya. Int. J. Nutr. Food Sci. 2025, 14(6), 456-474. doi: 10.11648/j.ijnfs.20251406.19
AMA Style
Shume N, Ochola S, Njogu E. Household Food Security and Complementary Feeding Practices Among Children 6-23 Months Old in Lungalunga, Kwale County, Kenya. Int J Nutr Food Sci. 2025;14(6):456-474. doi: 10.11648/j.ijnfs.20251406.19
@article{10.11648/j.ijnfs.20251406.19,
  author = {Naomi Shume and Sophie Ochola and Eunice Njogu},
  title = {Household Food Security and Complementary Feeding Practices Among Children 6-23 Months Old in Lungalunga, Kwale County, Kenya},
  journal = {International Journal of Nutrition and Food Sciences},
  volume = {14},
  number = {6},
  pages = {456-474},
  doi = {10.11648/j.ijnfs.20251406.19},
  url = {https://doi.org/10.11648/j.ijnfs.20251406.19},
  eprint = {https://article.sciencepublishinggroup.com/pdf/10.11648.j.ijnfs.20251406.19},
  abstract = {Globally, undernutrition is among the top causes of morbidity and mortality among children 6-23 months old. In Lungalunga, Kwale County, Kenya, similarly to many parts of the county, only 30.4% of children aged 6–23 months receive appropriate complementary feeding (Minimum Acceptable Diet (MAD)); a composite indicator of Minimum Dietary Diversity (MDD) and Minimum Meal Frequency (MMF). Kwale County is a semi-arid land (ASAL) and experiences chronic food insecurity. This study therefore, sought to establish the state of household food security and how it is related to complementary feeding practices among children 6–23 months old in Lungalunga, Kwale County. The study used a cross-sectional analytical research design and to select the study participants, multistage random sampling was used. In-person interviews were conducted at the household to collect information on complementary feeding practices and household food security. For analysis, the study used Statistical Package for Social Sciences (SPSS) version 27. Chi-square test, Fisher’s exact, linear by linear and logistic regression were used to establish the association between the variables. A statistical significance level (p-value) of <0.05, corresponding to a 95% confidence level was used. About one-tenth (8.1%) of the households experienced severe hunger, 34.7% moderate hunger and 57.1% experienced little to no hunger. All (100%) of the children had received soft, semi-solid or solid meals based on a twenty-four recall. Around three-quarters (76.8%) of the children achieved MMF, 24.1% attained MDD, and only 21.6% had MAD. Significant relationships were observed between all the three indicators of complementary feeding practices (MMF, MDD and MAD) and household food security at a p <0.01. Children from households that experienced moderate hunger had 30% higher odds (OR = 1.298, 95% CI = [1.118, 1.753], p =0.011) of attaining MMF than those experiencing severe hunger, those experiencing 'little to no hunger' were 87% more likely (OR = 1.87, 95% CI = [1.173, 2.473], p < 0.01) to achieve MDD than those experiencing severe hunger and those that experienced 'little to no hunger' had 19% higher odds (OR = 1.191, 95% CI = [1.075, 1.488], p = 0.001) of meeting the MAD than those in severe hunger category. Breastfeeding among children, wealth index, caregivers’ occupation and level of education and household food security were significant predictors of complementary feeding. Therefore, addressing household food security in Lungalunga will significantly improve the complementary feeding practices of children 6-23 months old.},
 year = {2025}
}
TY  - JOUR
T1  - Household Food Security and Complementary Feeding Practices Among Children 6-23 Months Old in Lungalunga, Kwale County, Kenya
AU  - Naomi Shume
AU  - Sophie Ochola
AU  - Eunice Njogu
Y1  - 2025/12/09
PY  - 2025
N1  - https://doi.org/10.11648/j.ijnfs.20251406.19
DO  - 10.11648/j.ijnfs.20251406.19
T2  - International Journal of Nutrition and Food Sciences
JF  - International Journal of Nutrition and Food Sciences
JO  - International Journal of Nutrition and Food Sciences
SP  - 456
EP  - 474
PB  - Science Publishing Group
SN  - 2327-2716
UR  - https://doi.org/10.11648/j.ijnfs.20251406.19
AB  - Globally, undernutrition is among the top causes of morbidity and mortality among children 6-23 months old. In Lungalunga, Kwale County, Kenya, similarly to many parts of the county, only 30.4% of children aged 6–23 months receive appropriate complementary feeding (Minimum Acceptable Diet (MAD)); a composite indicator of Minimum Dietary Diversity (MDD) and Minimum Meal Frequency (MMF). Kwale County is a semi-arid land (ASAL) and experiences chronic food insecurity. This study therefore, sought to establish the state of household food security and how it is related to complementary feeding practices among children 6–23 months old in Lungalunga, Kwale County. The study used a cross-sectional analytical research design and to select the study participants, multistage random sampling was used. In-person interviews were conducted at the household to collect information on complementary feeding practices and household food security. For analysis, the study used Statistical Package for Social Sciences (SPSS) version 27. Chi-square test, Fisher’s exact, linear by linear and logistic regression were used to establish the association between the variables. A statistical significance level (p-value) of <0.05, corresponding to a 95% confidence level was used. About one-tenth (8.1%) of the households experienced severe hunger, 34.7% moderate hunger and 57.1% experienced little to no hunger. All (100%) of the children had received soft, semi-solid or solid meals based on a twenty-four recall. Around three-quarters (76.8%) of the children achieved MMF, 24.1% attained MDD, and only 21.6% had MAD. Significant relationships were observed between all the three indicators of complementary feeding practices (MMF, MDD and MAD) and household food security at a p <0.01. Children from households that experienced moderate hunger had 30% higher odds (OR = 1.298, 95% CI = [1.118, 1.753], p =0.011) of attaining MMF than those experiencing severe hunger, those experiencing 'little to no hunger' were 87% more likely (OR = 1.87, 95% CI = [1.173, 2.473], p < 0.01) to achieve MDD than those experiencing severe hunger and those that experienced 'little to no hunger' had 19% higher odds (OR = 1.191, 95% CI = [1.075, 1.488], p = 0.001) of meeting the MAD than those in severe hunger category. Breastfeeding among children, wealth index, caregivers’ occupation and level of education and household food security were significant predictors of complementary feeding. Therefore, addressing household food security in Lungalunga will significantly improve the complementary feeding practices of children 6-23 months old.
VL  - 14
IS  - 6
ER  -
Department of Food, Nutrition and Dietetics, Kenyatta University, Nairobi, Kenya
Biography: Naomi Shume is a master’s degree in Food Nutrition and Dietetics student at Kenyatta University and holds a bachelor’s degree in the same from Kisii University, (2017).
Research Fields: Food security, Maternal and Child health and nutrition.

Department of Food, Nutrition and Dietetics, Kenyatta University, Nairobi, Kenya
Biography: Sophie Ochola is a Professor of Public Health Nutrition in the Department of Food, Nutrition and Dietetics at Kenyatta University, Kenya. She has a PhD in in Nutritional Sciences from the Stellenbosch University, Capetown and MSc in Applied Human Nutrition from University of Nairobi, Nairobi Kenya. Her area of expertise includes Infant and Young Child Feeding particularly in Humanitarian contexts; where she has conducted a lot of research to identify the drivers of acute malnutrition, evaluated programmes and made recommendations for programme improvement. Sophie has published widely on the area of infant and Young child feeding and drivers of child acute malnutrition.
Research Fields: Maternal and Young Child Nutrition particularly in humanitarian context, Overweight and Obesity and the accompanying Non- Communicable Diseases, Adolescent Nutrition, evaluation and designing of programmes.

Department of Food, Nutrition and Dietetics, Kenyatta University, Nairobi, Kenya
Biography: Eunice Njogu is a Senior Lecturer in the Department of Food, Nutrition and Dietetics at Kenyatta University. She received her PhD and MSc Degrees in Food, Nutrition and Dietetics and a B.Ed Degree in Home Economics from Kenyatta University, Kenya. Her area of specialization is community nutrition in relation to farming. She has published widely in peer reviewed journals of which she is also a reviewer. Dr. Eunice does gardening for Ecotherapy a strategy to promote physical and mental well-being.
Research Fields: Food and nutrition security and health, maternal and child nutrition and nutrition throughout the lifecycle.